This tutorial shows how to use the Grid Layer with
Township/Range/Section information. It will draw two different plots into two
different sections using T/R/S information.
One plot will be drawn in section 1 and the other plot will be drawn in
section 11.
Note: This tutorial was written using v5.7.1 of Metes and Bounds. If you are using a newer version, your screenshots may vary. But the basic functionality should be the same. Also, this tutorial assumes that are using a registered Pro edition. If you are using the Basic or Free edition, not all of these features will be available.
Setting Up the Drawing:
Start by creating a New Drawing.
Set the drawing's options to the following parameters:
-
Origin: Center of Drawing
-
Scale: 1" = 3000'
Creating the Grid Layer:
Choose Add New Advanced Layer from the Layers menu.
Choose the Grid Layer type.
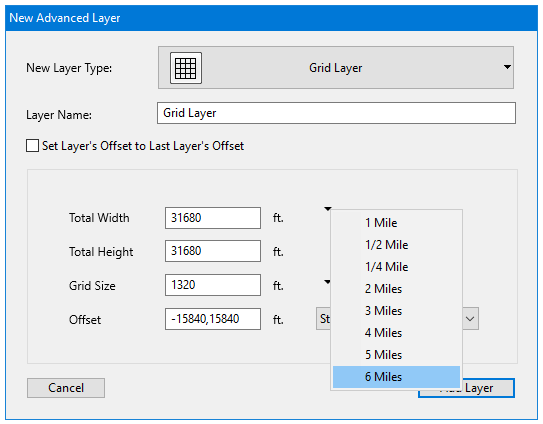
To create a 6x6 grid, click on the popup menu widget and select 6 Miles. The form will populate with the following information:
-
Total Width: 31680
-
Total Height: 31680
-
Grid Size 1320
-
Offset: -15840,15840
-
Style 1 - Note, this is optional, but will give the grid a bit more color definition.
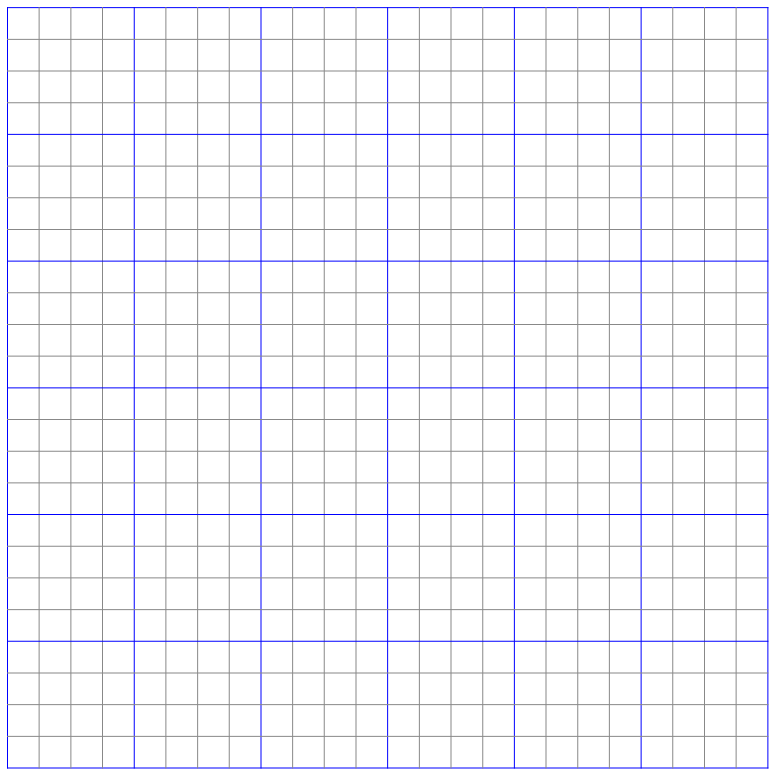
This will put the center of the grid at the center of the drawing. Your grid should look like this if you picked Style 1.
Layer 0:
Now switch back to Layer 0.
Press the Data Entry Form button.
Choose the Corner Tab.
Click on the disclosure widget to display the township/range/section information.
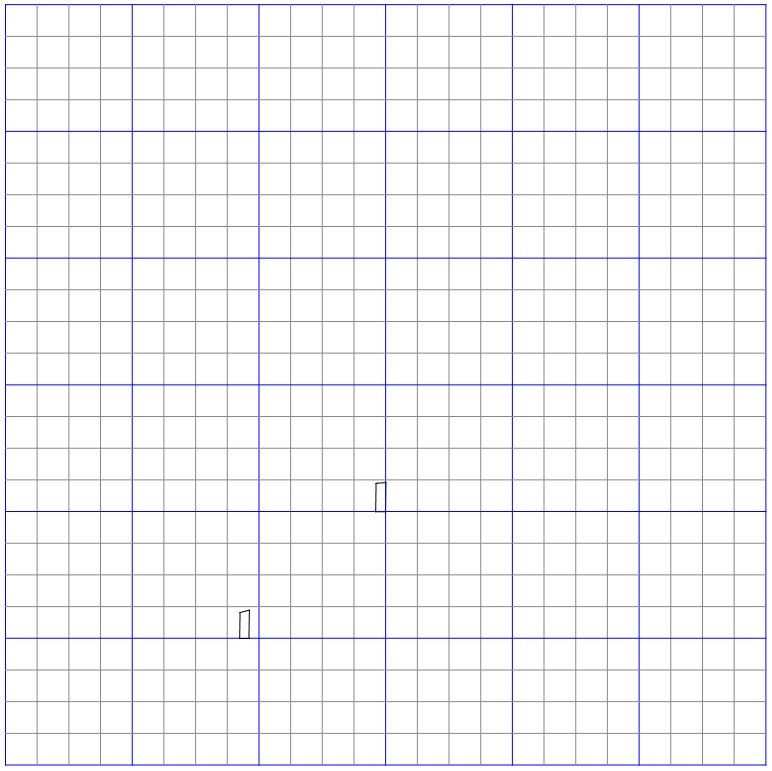
The first plot will be drawn in the bottom, right of section 1.
Enter the following information:
-
Quarter Call: SE/4
-
Corner: SE
-
Section Corner: Top Right
-
Origin: 2S 3W S1
-
Current: 2S 3W S1
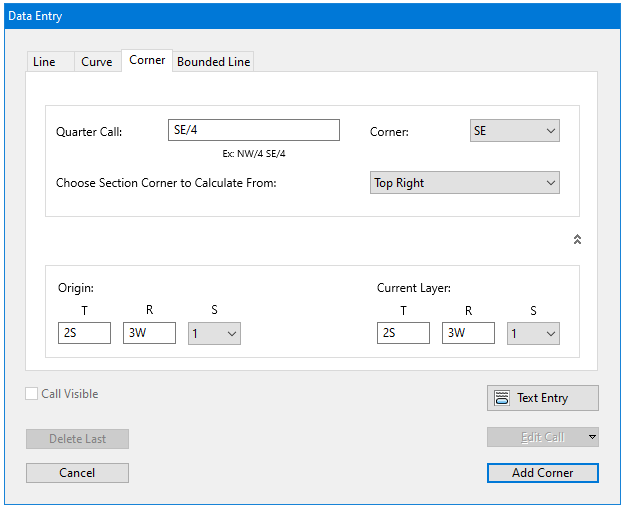
Press the Add Corner button.
Press the Done button to close the Data Entry window.
Now open the Text Entry form and copy/paste the following calls. The Text Entry form can be found by opening the Data Entry Form and pressing the Text Entry button. The Text Entry form can also be added to the toolbar from the preferences.
N 0:40:15 E 1213
S 86:41 W 354.1
S 75:45:12 W 57.07
S 0:44:52 W 1178.49
N 90 E 410
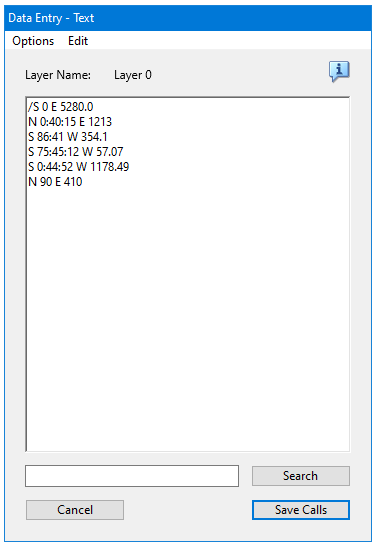
Press the Save Calls button.
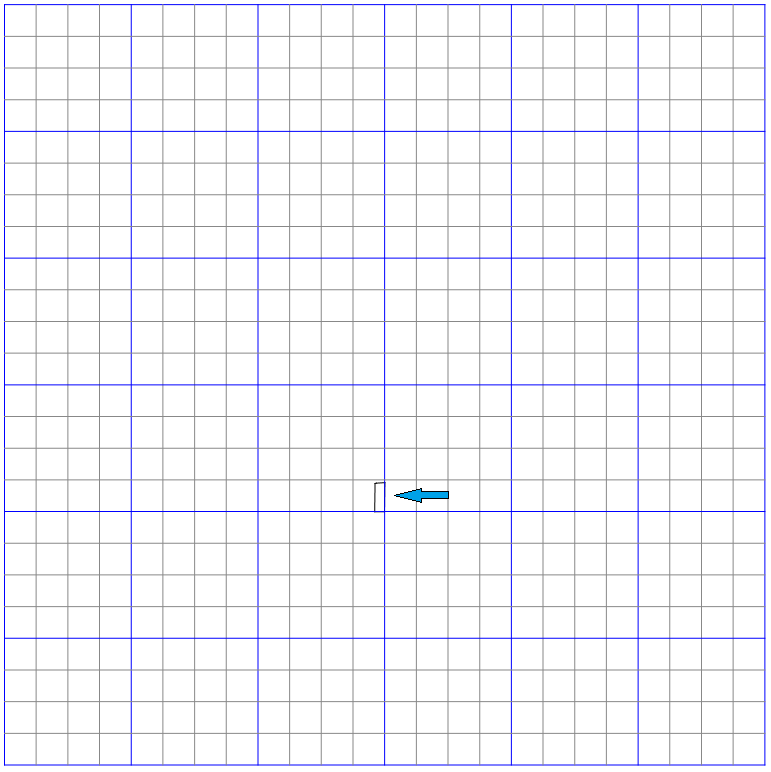
The drawing should now look like this:
Now lets examine why the software put the layer where it did.
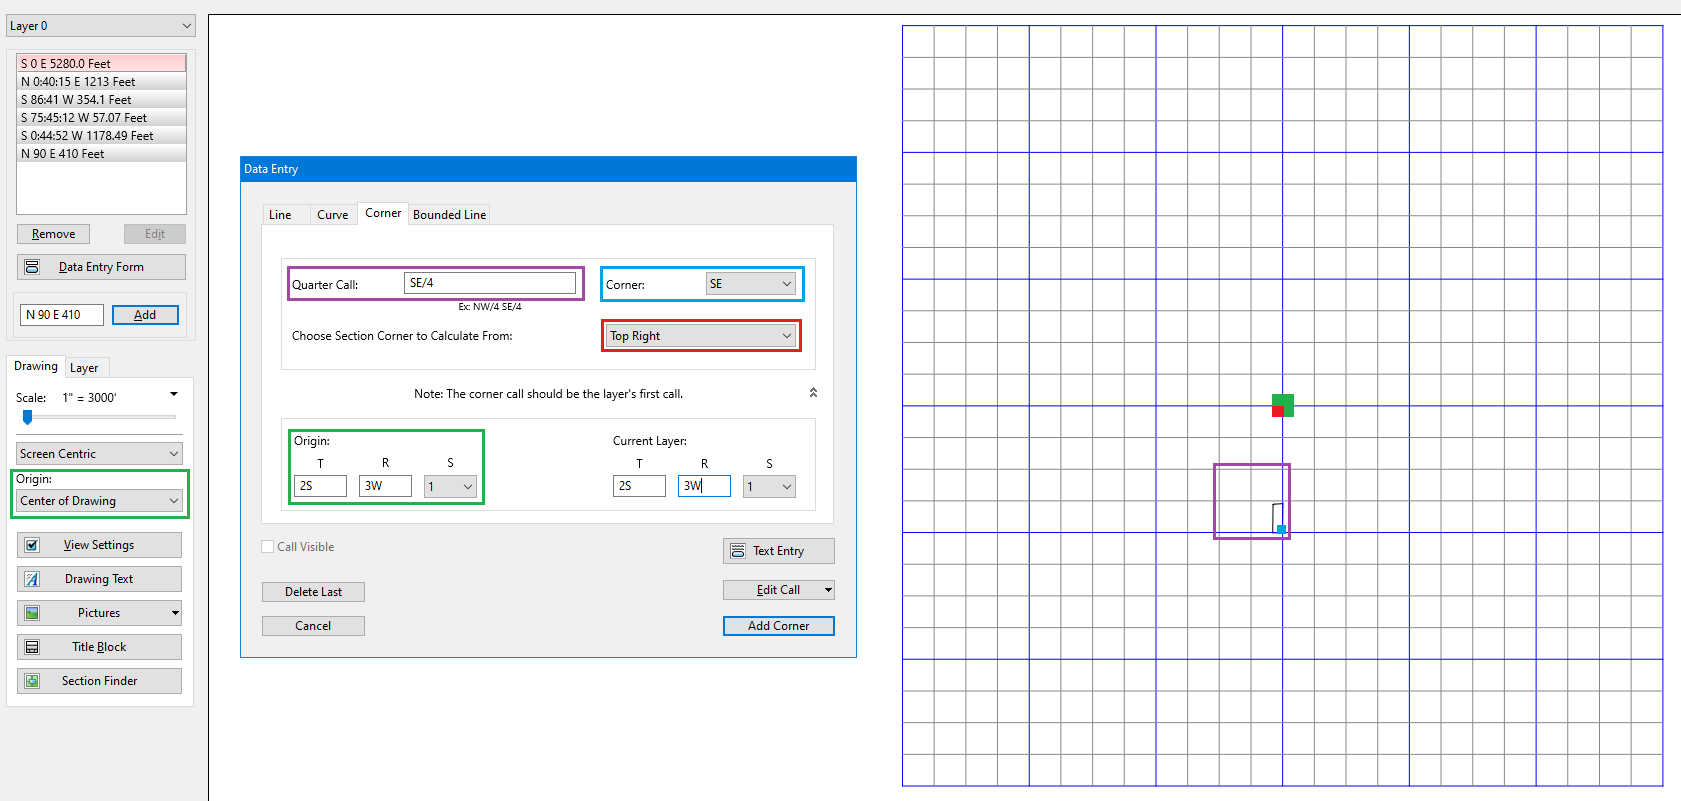
When the grid layer was created, the offset used placed the center of the grid
at the drawing's origin, which is Center of Drawing. On the corner tab, the
origin TRS values told the software that the center was section 1. This is
highlighted in green.
By choosing the Top Right section corner, the software knew to start calculating
from the top, right of section 1. This is highlighted in red.
The chosen quarter call is highlighted in purple and which corner to start at is
highlighted in blue.
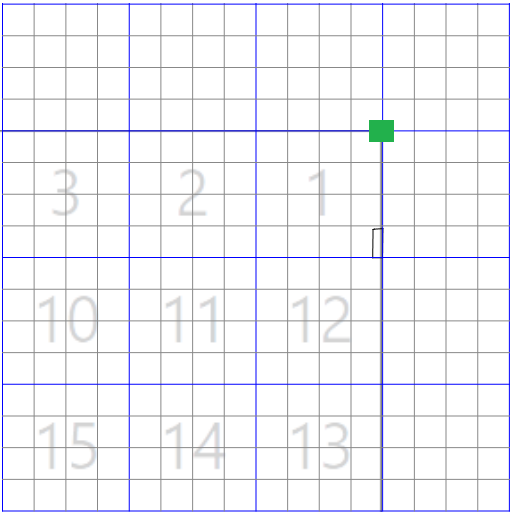
Here is another example with a numbered background picture showing how the section numbers line up with the grid:
Layer 2:
Now create a new layer by choosing Add New Layer from the Layers menu.
Open the Data Entry Form and choose the Corner Tab.
Enter the same information as for Layer 0, only this time choose Section 11 for the current layer:
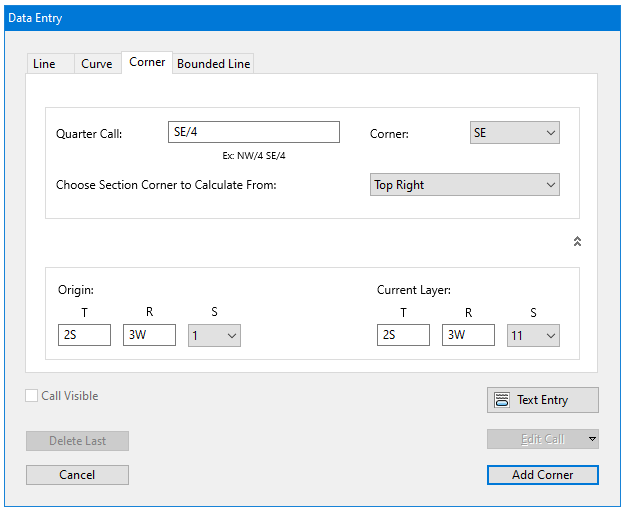
Press the Add Corner and Done buttons.
Open the Text Entry form again and copy/paste the following calls:
/N 90 W 410
N 0:44:52 E 1178.49
S 75:45:12 W 390.7
S 80:55:6 W 9.1
S 0:44:51 W 1082.3
N 90 E 386.42
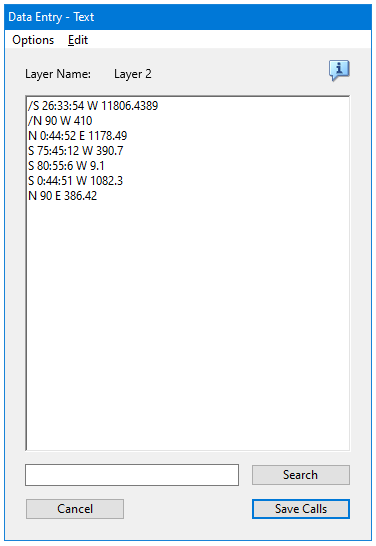
Press the Save Calls button.
The drawing should now look like this: