This tutorial will show you how to scale a background image, like a section map, and how to automatically place multiple plots (layers) within the background picture.
See Tutorial #5 and Tutorial #6 for similar projects.
Note: This tutorial assumes that are using a registered Pro version. If you are using the Basic or Unregistered version, not all of these features will be available. However, this tutorial will attempt to make it clear when a step or feature requires the Pro version.
Note: This tutorial was written for use with v5.6.1 of Metes and Bounds. If you are using a newer version, your screenshots may look slightly different. But the basic functionality should be the same.
Start by creating a new drawing. A new drawing is created when the program first starts up or you can create a new drawing by choosing New Drawing from the File menu.
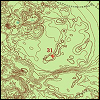
The first thing we are going to do is set a topographical section map as a background. The section image represents one square mile.
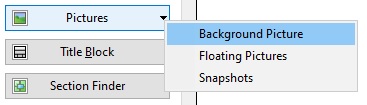
Start by clicking the Pictures->Background Picture button on the main Drawing tab.
This will bring up the Background Picture form.
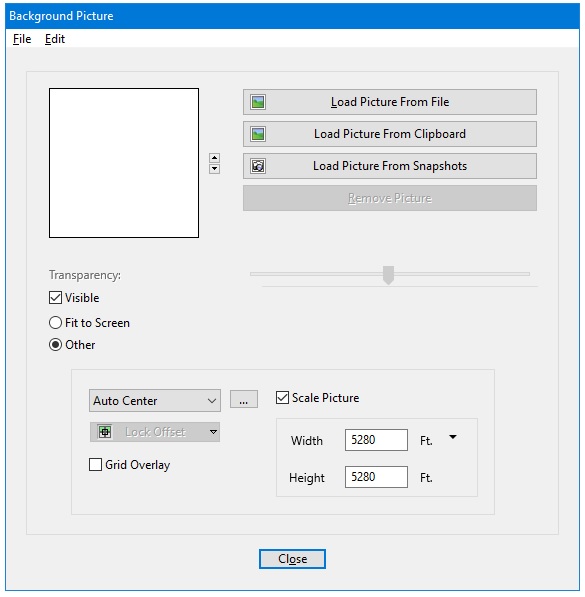
- Click the Load Picture button.
- Browse to the Tutorial 1 Sample Files folder. This folder is in the folder where Metes and Bounds is installed.
- Choose the background.jpg file.
- The background should now look something like this:
- Now click the "Other" radio button. (Note: These next few steps require Basic or Pro version.)
- Check the Scale Picture checkbox. Make sure that the scale width and height are both 5280 feet (1 mile). Note: Depending on your drawing's current scale setting, the background image may disappear at this point.
- Choose 'Bottom Right at Center' from the picture origin popup menu. In a future step we will choose a similar origin for our layers. This ensures that the background and layers will have the same reference point so that the layers will be drawn at the appropriate place on the background picture.
- Press the Close button to close the Background Picture form.
Next we will select a starting scale for our drawing. To do this either click on the scale popup menu triangle on the Drawing Tab, or choose Set Scale from the Tools menu. For our drawing, choose 1 inch = 1000 feet.
Now choose Center of Drawing from the Origin popup menu on the Drawing tab. As mentioned earlier, this gives the background and the layers a common point of reference. (Note: This requires the Pro version.)
Now we will start entering the data for our plots. Below are the legal descriptions that we will be using:
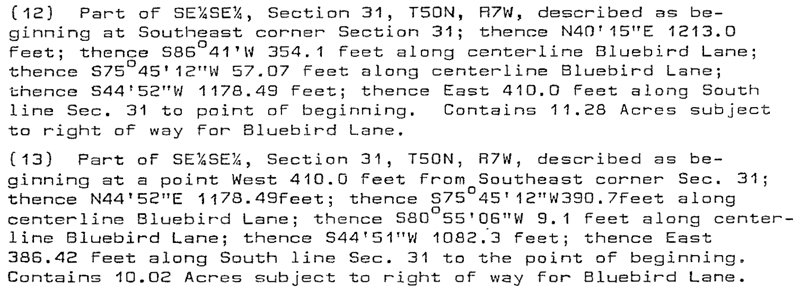
Let us start with plot #12.
Start by pressing the Data Entry button near the top half of the main drawing window.
This will bring up the Data Entry form.
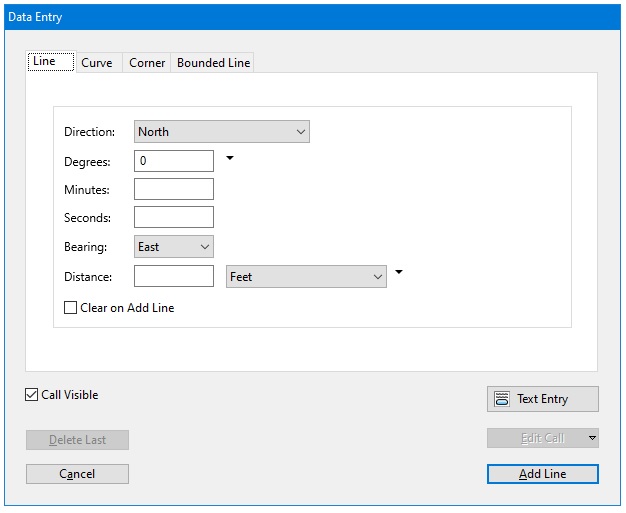
For the first call of plot #12 enter the following:
- North
- 0 Degrees
- 40 Minutes
- 15 Seconds
- Bearing East
- 1213 Feet
Now press the Add Line button.
For the second call enter the following:
- South
- 86 Degrees
- 41 Minutes
- 0 Seconds
- Bearing West
- 354.1 Feet
Press the Add Line button again.
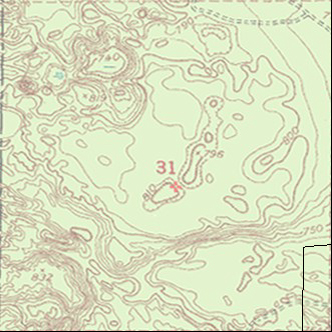
Continue entering the calls for plot #12. When you are done entering the calls, press the Done button to close the Data Entry form. Your drawing should now look something like this:
Now lets give this layer a useful name. Choose Rename Current Layer from the Layers menu. Change the name to "Plot 12" and press the Rename button.
Now lets create a new layer for Plot 13.
- Choose Add New Layer from the Layers menu.
- Enter "Plot 13" for the plot's name.
- Press the Add Layer button.
Next we will enter the calls for Plot 13. Press the Data Entry button to reopen the Data Entry form.
For the first call of Plot 13, we need to make an invisible line, so make sure that the Call Visible checkbox is unchecked. The invisible call will offset the layer's POB (Point of Beginning) from the section corner. The invisible call will not be drawn on screen and will not be included in calculations like finding the plot's area. You can tell that a call is invisible in the main call list by its reddish highlight.

So the first call of Plot 13 would look like this:
- Direction: Due West
- 410 Feet
- Call Visible: Unchecked.
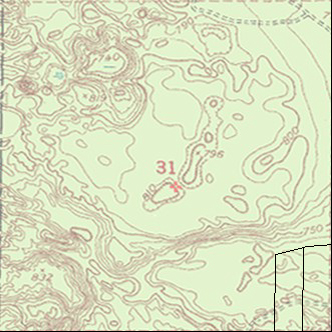
Now make sure to recheck the Call Visible checkbox and continue enter the calls for Plot 13. Again, press the Done button to close the Data Entry form when finished. Your drawing should now look like this:
Next we will move the background and layers into the middle of the drawing area.
- Start by reopening the Background Picture form.
- Click on the Lock Offset menu button and choose Plot 12 from the menu. This will lock the background's offset to the same offset as Plot 12. We can't directly move the background picture. But by locking it to the offset of Plot 12, whenever Plot 12's offset changes, the background picture's offset will change with it. (Note: This feature will only be available in the Basic and Pro versions.)
- Press the Close button to close the Background Picture form.
- Move the mouse cursor over either Plot 12 or Plot 13. You will notice that the cursor changes to a hand.
- Hold down the Shift Key. Press and hold the left mouse button. Drag the plots to the center of the screen. Holding down the Shift Key moves all of the layers at the same time. Otherwise, only the layer that you clicked in would move.
A copy of the finished file (Tutorial 1 Sample File.mabf) can be found in the Tutorial 1 Sample Files folder.